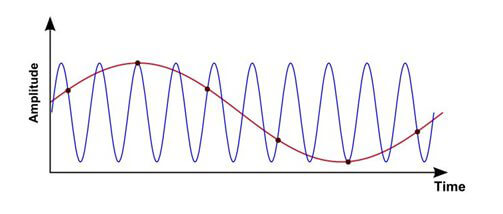
Aliasing is an interesting phenomenon, whose understanding is useful when selling or using dynamic signal analyzers and controllers. Although all Dynatronic equipment and most modern analyzers virtually eliminate this problem, many low-end solutions and general data acquisition solutions do not adequately address aliasing.
When analog data is sampled into digital data, aliasing is an unavoidable consequence. To understand aliasing, it often helps to look at a pure sine wave in the time domain as it is converted from an analog to a digital form. In the example below, it can be seen that two sine waves of different frequencies can overlay exactly on the sampled data points. In its most basic sense, this is aliasing. If the sine wave is not sampled at a high enough frequency, it will appear as the lower frequency sine wave, in other words becoming an alias.

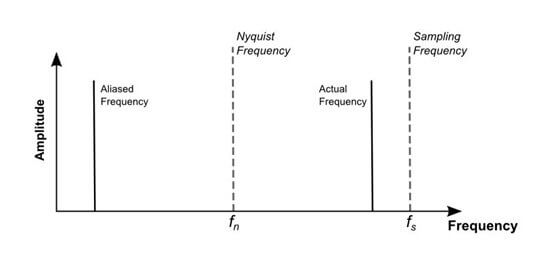
In the frequency domain, the representation of aliasing is shown below. The high frequency signals are “folded” back to lower frequencies, reflecting about the Nyquist frequency.

In Fourier processing, the Nyquist Frequency is the maximum observable frequency, and is equal to half the sampling frequency. The Nyquist Frequency acts as a mirror or “folding line” for the aliased signals. Theoretically, the Nyquist Criterion indicates that the sampling frequency should be at least twice the highest frequency of interest to avoid aliasing errors.
Despite the maturity of the science of signal analysis, many users and manufacturers of measurement equipment still incorrectly assume that simply sampling higher than twice the desired frequency will solve aliasing problems. But desired frequency may not be the same as the frequency contained in the signal. There is no sampling frequency however high that will solve this problem. The problem presented by aliasing is really that multiples of the Nyquist Frequency also act as folding lines. So frequency content that is greater than the sampled rate (double the Nyquist Frequency) also reflect back in to the frequency band of the measurement.
In any real world signal, there will be many forms of high frequency energy and noise that can fold back into the measurement band. This includes high frequency noise that can erode the dynamic range of the measurement and overall measurement quality.
The only way to avoid aliasing is to apply an anti-alias filter to limit the high frequency content that is outside the measurement frequency band. This filter must be an analog filter. Sampled data can be further down sampled using digital anti alias filter, sometimes also referred to as a decimation filter. Since an ideal filter (perfect brick wall) cannot be created without other consequences and analog filters all have roll off characteristics, the roll off of the filter creates a transition band as illustrated below.
To be consistent with commonly used anti-aliasing filters, an industry standard for guard band has evolved to make the sampling rate 2.56 times the maximum frequency of interest. This is known as the guard band ratio. A guard band ratio of 2.56 provides aliasing protection to the instrument's specified limit. SignalCalc analyzers typically use anti alias filters with more aggressive roll off and allow the user to manually adjust the guard band ratio to be able to make use of a larger frequency band for any sampling frequency of the analyzer. This feature needs to be used with caution as it also allows the user to observe the spectrum in the transition band where there is progressive attenuation of frequency content and the potential for the presence of attenuated aliased content.